
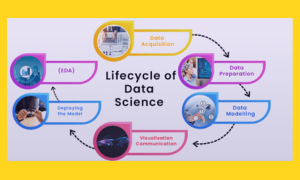
Data science is a rapidly growing field that combines statistical analysis, programming, and machine learning techniques to extract insights from large and complex datasets. As a result, data science syllabi are designed to provide students with a comprehensive understanding of the fundamentals of data science, including data processing, analysis techniques, machine learning, and data visualization.
A typical data science syllabus covers a range of topics, starting with an introduction to data science and its applications in various industries. Students then learn about the fundamentals of data science, including data types, structures, and algorithms. The syllabus also includes a section on data processing, which covers data cleaning, transformation, and integration. In addition, students learn about various data analysis techniques, such as regression analysis, clustering, and classification. Finally, the syllabus covers machine learning, which includes supervised and unsupervised learning, as well as deep learning techniques.
Key Takeaways
- Data science syllabi provide a comprehensive understanding of the fundamentals of data science, including data processing, analysis techniques, machine learning, and data visualization.
- Students learn about data types, structures, algorithms, data cleaning, transformation, integration, regression analysis, clustering, classification, and deep learning techniques.
- Data science projects and real-world case studies are an essential part of the syllabus, which helps students apply their knowledge to solve real-world problems.
Fundamentals of Data Science
Data Science is an interdisciplinary field that combines statistical analysis, programming, and domain expertise to extract insights from data. The Fundamentals of Data Science is an essential course that provides a strong foundation in the basic concepts and tools used in data science.
Statistics and Probability
Statistics and Probability are the building blocks of Data Science. A good understanding of these concepts is essential for analyzing and interpreting data. The Fundamentals of Data Science course covers the basics of probability theory, descriptive statistics, and inferential statistics. Students learn how to use statistical software packages such as R and Python to perform data analysis and visualization.
Programming for Data Science
Programming is a crucial skill for data scientists. The Fundamentals of Data Science course covers the basics of programming in Python and R. Students learn how to write code to manipulate data, perform statistical analysis, and create visualizations. The course also covers the basics of data cleaning and preprocessing, which are essential steps in any data science project.
Data Structures and Algorithms
Data Structures and Algorithms are essential tools for data scientists. The Fundamentals of Data Science course covers the basics of data structures such as arrays, lists, and dictionaries. Students learn how to use these data structures to store and manipulate data efficiently. The course also covers the basics of algorithms such as sorting and searching. Students learn how to use these algorithms to analyze and manipulate data.
In summary, the Fundamentals of Data Science course provides a solid foundation in statistics and probability, programming for data science, and data structures and algorithms. This course is essential for anyone who wants to pursue a career in data science.
Data Processing
Data processing is a critical aspect of data science that involves cleaning, transforming, and integrating data to make it usable for analysis. The following subsections discuss the various components of data processing.
Data Cleaning
Data cleaning is the process of identifying and correcting errors, inconsistencies, and inaccuracies in data. It is a crucial step in data processing as it ensures that the data is accurate and reliable. Data cleaning involves several tasks, including removing duplicates, filling in missing values, and correcting formatting errors.
One common approach to data cleaning is to use statistical methods to identify outliers or anomalies in the data. For instance, a data analyst may use box plots or scatter plots to identify data points that fall outside the expected range. Once the outliers are identified, the analyst can decide whether to remove them or correct them.
Data Transformation
Data transformation involves converting data from one format to another to make it usable for analysis. It is a critical step in data processing as it enables data analysts to extract meaningful insights from the data. Data transformation can involve several tasks, including normalization, aggregation, and feature extraction.
Normalization involves scaling the data to a common range to eliminate the effect of differences in measurement units. Aggregation involves summarizing data at a higher level to reduce its complexity and make it easier to analyze. Feature extraction involves selecting relevant features from the data and discarding irrelevant ones.
Data Integration
Data integration involves combining data from multiple sources to create a unified view of the data. It is a crucial step in data processing as it enables data analysts to analyze data from multiple sources. Data integration can involve several tasks, including data mapping, data warehousing, and data federation.
Data mapping involves identifying the common fields in different data sources and creating a mapping between them. Data warehousing involves storing data from multiple sources in a single location to enable easy access and analysis. Data federation involves creating a virtual view of the data from multiple sources without physically integrating the data.
In summary, data processing is a critical aspect of data science that involves cleaning, transforming, and integrating data to make it usable for analysis. Data cleaning ensures that the data is accurate and reliable, data transformation makes the data usable for analysis, and data integration combines data from multiple sources to create a unified view of the data.
Data Analysis Techniques
Data analysis techniques are an integral part of data science syllabus. The following subsections will discuss some of the most important data analysis techniques that data science students should learn.
Exploratory Data Analysis
Exploratory data analysis (EDA) is the process of analyzing data sets to summarize their main characteristics. The purpose of EDA is to understand the underlying patterns, relationships, and trends in the data. EDA helps data scientists to identify potential outliers, missing values, and other anomalies in the data. EDA techniques include visualizations such as scatter plots, histograms, and box plots.
Hypothesis Testing
Hypothesis testing is a statistical method used to determine whether a hypothesis about a population parameter is true or false. Hypothesis testing involves formulating a null hypothesis and an alternative hypothesis. The null hypothesis represents the status quo, while the alternative hypothesis represents the researcher’s hypothesis. The researcher then collects data and uses statistical methods to determine whether the null hypothesis can be rejected in favor of the alternative hypothesis.
Regression Analysis
Regression analysis is a statistical technique used to model the relationship between a dependent variable and one or more independent variables. Regression analysis is used to predict the value of the dependent variable based on the values of the independent variables. There are several types of regression analysis, including linear regression, logistic regression, and polynomial regression. Linear regression is the most commonly used type of regression analysis in data science.
In summary, data analysis techniques are crucial to the data science syllabus. Exploratory data analysis, hypothesis testing, and regression analysis are some of the most important data analysis techniques that data science students should learn. By mastering these techniques, data science students will be able to analyze and interpret data sets to extract meaningful insights.
Machine Learning
Machine learning is an integral part of data science and involves the use of algorithms that automatically improve with experience. It allows computers to learn from data and make predictions or decisions without being explicitly programmed. Data scientists use machine learning to build models that can analyze data and make predictions or decisions based on that data. There are three main types of machine learning: supervised learning, unsupervised learning, and reinforcement learning.
Supervised Learning
Supervised learning is a type of machine learning where the algorithm is trained on a labeled dataset. In this type of learning, the algorithm learns to predict the output variable from the input variable by using a set of labeled examples. These labeled examples are used to train the algorithm, and the algorithm then uses this knowledge to make predictions on new, unseen data. Supervised learning is commonly used in applications such as image recognition, speech recognition, and natural language processing.
Unsupervised Learning
Unsupervised learning is a type of machine learning where the algorithm is trained on an unlabeled dataset. In this type of learning, the algorithm learns to identify patterns and relationships in the data without being given any specific instructions. Unsupervised learning is commonly used in applications such as clustering, anomaly detection, and dimensionality reduction.
Reinforcement Learning
Reinforcement learning is a type of machine learning where the algorithm learns to make decisions by interacting with an environment. In this type of learning, the algorithm learns to maximize a reward signal by taking actions that lead to positive outcomes and avoiding actions that lead to negative outcomes. Reinforcement learning is commonly used in applications such as game playing, robotics, and autonomous driving.
Overall, machine learning is a powerful tool for data scientists that allows them to build models that can analyze data and make predictions or decisions based on that data. By understanding the different types of machine learning, data scientists can choose the appropriate algorithm for their specific application.
Data Visualization
Data visualization is an essential aspect of data science. It involves representing data in graphical or pictorial form to help people understand complex data. It is a powerful tool that can be used to identify patterns, trends, and relationships in data that might not be evident from looking at raw data.
Visualization Principles
To create effective data visualizations, it is important to understand the principles of visualization. Some of the principles include choosing the right chart type, using color effectively, and simplifying the display. The goal is to make the visualization easy to understand and interpret.
Tools and Software
There are many tools and software available for data visualization. Some of the most popular ones include Tableau, D3.js, and ggplot2. Each tool has its strengths and weaknesses, and the choice of tool depends on the type of data and the goal of the visualization.
Interactive Data Visualization
Interactive data visualization allows users to explore data in an interactive way. It allows users to manipulate the data and see the effect of the changes in real-time. Interactive visualizations can be created using tools like Plotly, Bokeh, and Highcharts. Interactive visualizations are useful for exploring data and communicating insights to others.
In conclusion, data visualization is an important aspect of data science. It allows data scientists to communicate insights effectively and helps others understand complex data. By understanding the principles of visualization and using the right tools and software, data scientists can create effective visualizations that communicate insights clearly.
Big Data Technologies
Big Data Technologies are an essential part of any data science syllabus. They enable data scientists to handle and manage large-scale datasets effectively. In this section, we will discuss three important Big Data Technologies: Hadoop and Spark, NoSQL Databases, and Stream Processing.
Hadoop and Spark
Hadoop and Spark are two of the most popular Big Data Technologies used in data science. Hadoop is a distributed file system that enables the storage and processing of large datasets across clusters of computers. Spark, on the other hand, is a fast and general-purpose cluster computing system that can handle both batch and streaming data.
According to Intellipaat, a data science syllabus should cover the concepts of distributed computing and parallel processing for effective big data management. Therefore, it is essential for data scientists to have a good understanding of Hadoop and Spark.
NoSQL Databases
NoSQL databases are non-relational databases that can handle unstructured and semi-structured data. They are designed to handle large volumes of data and provide high scalability and availability. Some examples of NoSQL databases include MongoDB, Cassandra, and Couchbase.
According to Simplilearn, NoSQL databases are an essential part of the data science syllabus. Data scientists need to understand the differences between NoSQL and relational databases like SQL and how to use them effectively.
Stream Processing
Stream processing is the processing of data in real-time as it is generated. It enables data scientists to analyze and extract valuable insights from data as it is being produced. Some popular stream processing frameworks include Apache Flink, Apache Storm, and Apache Kafka.
According to KnowledgeHut, stream processing is an important topic in the data science syllabus. Data scientists need to understand how to handle real-time data and how to use stream processing frameworks effectively.
In conclusion, Big Data Technologies are an essential part of any data science syllabus. Data scientists need to understand how to handle and manage large-scale datasets effectively, and Hadoop and Spark, NoSQL Databases, and Stream Processing are important tools for achieving this goal.
Data Science Projects
Data science projects are an essential component of any data science syllabus. They provide students with hands-on experience in solving real-world problems using data-driven approaches. Data science projects help students develop a deep understanding of the project lifecycle, case studies, and ethics and data privacy.
Project Lifecycle
The project lifecycle is a framework that helps data scientists manage data science projects from start to finish. It includes the following phases:
- Problem definition: In this phase, data scientists define the problem they want to solve and determine the project’s scope.
- Data collection and preparation: In this phase, data scientists collect and prepare the data required to solve the problem.
- Data exploration: In this phase, data scientists explore the data to gain insights into the problem they are trying to solve.
- Model building and evaluation: In this phase, data scientists build models to solve the problem and evaluate their performance.
- Deployment and monitoring: In this phase, data scientists deploy the model and monitor its performance.
Case Studies
Case studies are an integral part of data science projects. They provide students with real-world examples of how data science is being used to solve problems in various domains. Case studies help students understand the different approaches and techniques used in data science projects.
Ethics and Data Privacy
Ethics and data privacy are critical considerations in data science projects. Data scientists must ensure that they are using data ethically and protecting the privacy of individuals whose data they are using. Students must learn about the ethical and legal implications of using data in their projects and how to ensure that their projects comply with ethical and legal standards.
In conclusion, data science projects are an essential component of any data science syllabus. They provide students with hands-on experience in solving real-world problems using data-driven approaches. Students learn about the project lifecycle, case studies, and ethics and data privacy, which are critical considerations in data science projects.
Frequently Asked Questions
What subjects are included in a Data Science degree program?
A typical Data Science degree program includes subjects such as statistics, data visualization, machine learning, data mining, database management, and programming languages such as Python and R. In addition, students may also study subjects such as linear algebra, calculus, and probability theory.
Which topics are essential for beginners in Data Science?
For beginners, it is important to have a solid foundation in mathematics and statistics. This includes topics such as probability theory, statistical inference, and linear algebra. In addition, beginners should also have a good understanding of programming languages such as Python and R, as well as data visualization tools.
What are the core components of a Data Science curriculum?
The core components of a Data Science curriculum include statistics, programming, machine learning, and data visualization. These components are essential for analyzing and interpreting large amounts of data, and for making data-driven decisions.
Can you list the topics covered in a Master’s in Data Science syllabus?
A Master’s in Data Science syllabus includes topics such as data mining, machine learning, statistical modeling, data visualization, and database management. In addition, students may also study topics such as natural language processing, deep learning, and computer vision.
What advanced topics are taught in a Bachelor of Science in Data Science?
In a Bachelor of Science in Data Science program, students may study advanced topics such as big data analytics, cloud computing, and data warehousing. In addition, students may also study topics such as data ethics, data governance, and data security.
What are common themes for presentations in Data Science courses?
Common themes for presentations in Data Science courses include data visualization, data storytelling, and machine learning algorithms. In addition, students may also present on topics such as data cleaning and preprocessing, feature engineering, and model evaluation.